Observability Playbook for Distributed SaaS: Metrics, Traces and Logs
- all
Observability Playbook for Distributed SaaS: Metrics, Traces and Logs
Why observability matters for microservices in distributed SaaS
In modern cloud-native SaaS architectures, applications are decomposed into many small, interacting services. This increases resilience and scalability but also introduces new failure modes and complexity. Traditional monitoring—dashboards built from a few metrics—often fails to reveal why a service degraded, which user journeys were impacted, or where to intervene quickly during an incident.
Observability is the ability to understand the internal state of a system from its external outputs. For distributed SaaS, it enables engineers to diagnose incidents faster, prove reliability to customers through measurable SLAs, and continuously improve product performance. When implemented thoughtfully, observability becomes a strategic capability that shortens MTTR (mean time to repair), reduces toil, and supports data-driven capacity planning.
The goal is not merely to collect data; it is to turn signals into actionable insight. This requires a disciplined approach to what you measure, how you correlate signals across services, and how you respond when incidents occur. A well-planned observability program aligns with product reliability objectives and business KPIs, making it a core part of the engineering lifecycle rather than a one-off tooling project.
The observability triad: metrics, traces, and logs
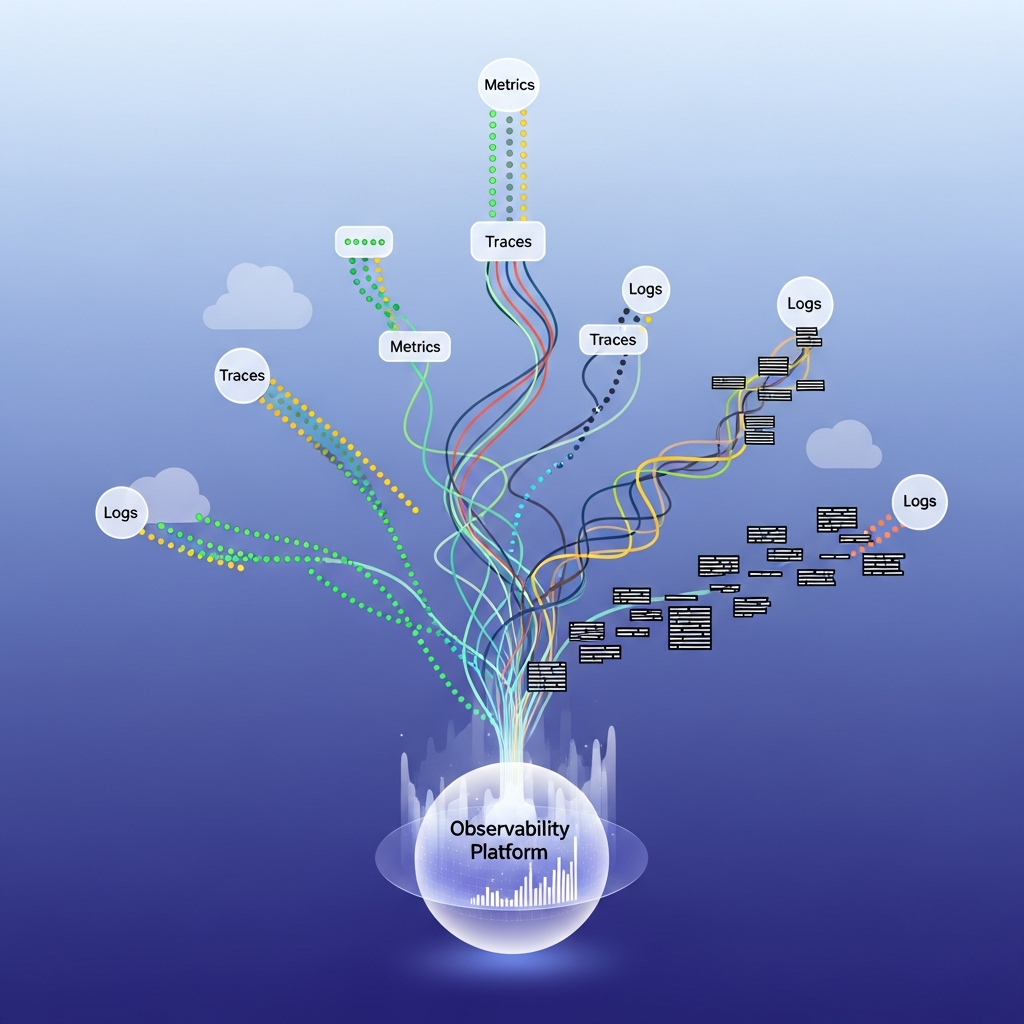
Observability rests on three core data types that complement each other:
- Metrics: Quantitative measurements that describe system state over time (latency, error rate, saturation, request rate, etc.). They provide a high-level view of health and trends through dashboards and alerting.
- Traces: Contextual pathways through distributed requests, revealing how a transaction flows across services. Traces expose latency bottlenecks, service dependencies, and tail latencies that metrics alone may miss.
- Logs: Unstructured or semi-structured records that capture events, errors, and milestones at specific points in time. Logs are indispensable for root-cause analysis and for capturing events that aren’t reflected in metrics or traces.
Together, these data streams enable rapid incident triage, precise impact assessment, and informed decision-making about capacity, performance, and product improvements. A common pitfall is treating one data type as sufficient; the real power comes from correlating signals across all three.
In practice, you should aim for a minimal viable observability setup within each service: collect essential metrics, generate meaningful traces, and capture targeted logs. As the system grows, you iteratively expand instrumentation to cover new features and critical user journeys.
Instrumentation patterns and what to measure
Effective observability starts with a deliberate plan for instrumentation. The following patterns help teams avoid data sprawl while delivering measurable value.
Map top product flows (onboarding, checkout, feature discovery) and instrument end-to-end latency and success rates for these paths. Collect data at service boundaries (APIs, queues, gateways) and within core business logic to capture application-specific signals. Apply standardized attributes (service, environment, version, region, tenant) to enable cross-service queries and correlation. Start with a few cross-cutting dashboards (latency distribution, error budget burn, dependency map) and evolve with product areas. Avoid collecting every possible metric; prioritize high-signal, low-noise metrics that drive decisions.
Key metrics to consider include latency percentiles (P50, P95, P99), error rates, request rate, CPU/memory saturation, queue depth, and the health of critical dependencies like databases, caches, and external services. For tracing, you’ll want to capture service spans for critical paths, with reasonable sampling to control data volume while preserving tail insights. Logs should include error messages, a correlation id, and contextual data that aids debugging without exposing sensitive information.
As you mature, link observability to reliability objectives. Tie metrics to SLOs, use traces to identify bottlenecks in critical paths, and leverage logs for root-cause analysis during incidents. The benefits extend beyond incident response: proactive capacity planning, performance optimization, and improved user experience are natural outcomes of a well-executed instrumentation strategy.
Distributed tracing best practices
Distributed tracing provides end-to-end visibility into requests as they traverse multiple services. To get the most value, adopt a pragmatic set of practices that balance visibility with data volume and operational overhead.
Trace context and propagation
Use a consistent trace context (for example, W3C Trace Context) and propagate trace IDs across all service boundaries. This enables your tracing backend to stitch together spans into coherent traces even as requests cross teams and platforms.
Sampling strategy
Implement a sampling strategy that captures enough traces to reveal tail latency patterns without overwhelming storage and processing costs. Consider adaptive sampling based on error rates or latency thresholds, with higher sampling on erroring or slow requests.
Span design and naming
Design spans to reflect meaningful operations rather than low-level implementation details. Use consistent naming conventions that align with business actions (e.g., CheckoutService.processPayment rather than internal method names).
Correlation with logs
Attach a correlation identifier to logs and traces so that analysts can jump between signals easily. This bridging is essential for root-cause analysis and post-incident investigations.
Practical tip: start with a trace-enabled path for high-risk features and gradually expand to broader parts of the system. Over time, your trace data becomes a valuable asset for capacity planning and performance optimization.
OpenTelemetry implementation guide
OpenTelemetry (OTel) is the industry-standard framework for instrumenting observability data. A pragmatic rollout focuses on choosing the right components, standardizing data models, and ensuring reliable collection and export paths.
Key components
Use language-specific SDKs to instrument code and generate traces, metrics, and logs consistently. - Collectors and exporters: Deploy an OpenTelemetry Collector to normalize data and export to backends (e.g., Prometheus, Jaeger, Grafana Loki, or a cloud-native sink).
- Export backends: Choose backends based on your needs—tracing for latency insight, metrics for dashboards, logs for debugging, and dashboards for operator visibility.
Deployment pattern
Adopt a layered pattern: instrument code with OTel SDKs, route all signals to a central collector, and export to multiple backends for redundancy and diverse use cases. Start with core services and critical paths, then expand to supplementary components as requirements mature.
Governance and data quality
Define data models, naming conventions, and sampling rules upfront. Enforce data quality gates in your CI/CD to prevent invalid or low-signal data from polluting dashboards and alerts.
SLOs and monitoring for cloud-native systems
Service Level Objectives (SLOs) are explicit reliability targets tied to user experience. They help engineering teams balance feature velocity with stability and provide objective criteria for incident response and capacity planning.
Defining SLOs
- Choose user-centric reliability metrics (e.g., request latency percentiles, error rate, and availability for critical workflows).
- Set SLO targets that reflect user impact and business priorities (e.g., 99.9% of checkout requests must complete within 2 seconds).
- Establish error budgets that quantify how much unreliability is tolerable over a given period.
Monitoring and alerting
Align alerts with error budgets and avoid alert fatigue by tuning thresholds and deduplicating noisy signals. Implement multi-tier alerting (poke, alert, and on-call escalation) and ensure on-call rotations reflect the production footprint of critical services.
Practical tip: create SLO dashboards that show burn rate (actual vs. target) and signal the team when the error budget is being consumed too quickly. This makes reliability a visible business objective, not an afterthought.
Log aggregation, retention, and data management
Logs are invaluable for debugging, but unmanaged log volume can become a liability. A disciplined approach helps you retain the right data long enough to investigate incidents while controlling costs.
What to log
Log events that matter for debugging and incident response: errors with stack traces, correlation IDs, user impacts, feature flags, and key state transitions. Avoid logging sensitive data; implement redaction and masking where needed.
Retention policies
Define retention windows based on data criticality and compliance requirements. Shorten retention for verbose debug logs in non-prod environments; preserve longer retention for production error data and security events as needed.
Searchability and indexing
Standardize log formats (structured logs with key-value pairs) to enable fast searches. Use a central indexing system to support real-time alerting and post-incident analysis.
Incident response runbooks and playbooks
Incident response is where observability translates into reliable operations. A well-defined runbook reduces time to containment, speeds restoration, and improves post-incident learning.
Core elements
Clear on-call responsibilities, escalation paths, and contact channels. Predefined indicators (latency spikes, error surges, degraded dependencies) and business impact notes. Quick-start steps to validate signals, identify the affected service, and determine blast radius. Concrete actions to stabilize the system, including feature flags and configuration changes. Templates for stakeholder updates, customer notifications, and incident closure summaries. A structured retrospective with data-backed learnings and action items to prevent recurrence.
Design runbooks with real-world examples. For distributed SaaS, document how a single incident in a core service can cascade and what compensating controls to apply while a fix is rolled out. Regular drills help teams stay prepared and improve collaboration during real events.
Rollout plan: from pilot to production
A staged rollout reduces risk and validates observability investments incrementally. Follow a discipline-driven path from pilot to broad adoption across the platform.
Phase 1 — Pilot
- Instrument a small, representative set of services and establish baseline dashboards.
- Define a minimal set of SLOs and alert rules for the pilot domain.
- Validate data quality, correlation IDs, and the end-to-end path for critical user journeys.
Phase 2 — Expansion
- Scale instrumentation to additional services and dependencies.
- Standardize dashboards, alerts, and logs across the expanding domain.
- Refine sampling strategies and data retention policies based on observed usage and cost.
Phase 3 — Production-wide adoption
- Institutionalize observability as part of the release process and CI/CD gates.
- Integrate with incident response drills and post-mortems.
- Continuously optimize data pipelines, retention, and alerting rules.
Document measurable milestones for each phase and establish a feedback loop with product teams to ensure observability supports customer outcomes.
Common pitfalls and best practices
Avoid the most common missteps that derail observability initiatives.
Collecting too much data creates noise. Prioritize signal over noise and phase in new signals gradually. Cross-team dashboards help create shared understanding; avoid isolated views that hinder collaboration. Without standardized naming, queries become brittle and inconsistent across services. Metrics alone won’t reveal root causes; combine traces and logs for context. Bad instrumentation leads to misleading dashboards. Invest in data quality gates and review cycles.
Best practice: maintain an observability charter that defines data types, access controls, retention rules, and governance. This keeps the program focused on measurable outcomes and enterprise needs.
Tooling and vendor considerations
Choose an ecosystem that supports your cloud strategy, scale requirements, and data governance policies. A pragmatic toolset includes:
- Tracing backends (e.g., Jaeger, OpenTelemetry Collector, or cloud-native tracing).
- Metrics platforms (Prometheus with Grafana, or equivalent cloud metrics services).
- Log systems (Loki, Elasticsearch, or cloud log management).
- Visualization and dashboards that enable quick operator actions and product insights.
When evaluating vendors, consider: data residency, security certifications, integration with existing ERPs/CRMs, on-call governance, and the ability to support offshore or distributed teams with clear SLAs.
Governance and ROI: turning observability into business value
Observability is not only about technology; it is a governance and operating model. Establish a center of excellence for observability, define ownership, and link reliability outcomes to business metrics such as churn reduction, onboarding speed, and SLA attainment.
ROI considerations
- Reduced MTTR and faster incident resolution directly lowers downtime costs.
- Improved onboarding and activation metrics through visibility into funnels and user journeys.
- Better capacity planning and forecasting via signal-driven capacity metrics.
Track ROI with a simple model: measure hours saved in incident response, changes in SLA compliance, and improvements in critical user metrics over a defined period. Use these data points to justify ongoing investment and expansion of instrumentation.
Next steps for implementing this playbook
Start with a focused pilot on a high-impact domain, align your product and platform teams around a common observability language, and define a lightweight governance model. From there, gradually broaden instrumentation, expand SLO coverage, and institutionalize runbooks and post-incident reviews.
If you’re launching a distributed SaaS platform and want guidance tailored to your stack and regulatory requirements, consider a structured discovery session to map your current telemetry gaps, define the minimal viable observability, and outline a phased rollout plan.
Note: This article is designed to equip technology leaders with practical patterns for instrumenting cloud-native systems. For tailored guidance on your stack, reach out to your engineering leadership team to review instrumentation strategies, SLO definitions, and incident response readiness.